KINETIC STUDIES OF PRESSURE-JUMP INDUCED PHASE-TRANSITIONS OF
PHOSPHOLIPIDS BY TIME-RESOLVED SMALL-ANGLE X-RAY SCATTERING (SAXS).
M. Kriechbaum(1), H. Amenitsch(1), M. Steinhart(2) and S. Bernstorff(3).
- 1.) Institute of Biophysics and X-Ray Structure Research, Austrian Academy of Sciences,
Graz, Austria.
Present address: Institute of Inorganic Chemistry, Graz University of Technology, Graz, Austria.
- 2.) Institute of Macromolecular Chemistry, Academy of Sciences of the Czech Republic, Prague,
Czech Republic.
- 3.) Sincrotrone Trieste, Basovizza, Trieste, Italy.
We have performed kinetic studies on pressure-jump induced phase transitions of phospholipids
monitored by time-resolved X-ray scattering with millisecond time-resolution in the
SAXS (10-200 A) and WAXS (3-6 A) region using a high-pressure X-ray
cell as described in [1, 2] at the
SAXS-beamline at
ELETTRA, Trieste, Italy. In these studies we have focused on the kinetics of barotropic phase
transitions of the phosphatidyl-ethanolamine (PE) lipids DOPE and SOPE, respectively, by
applying pressure-jump amplitudes up to 1.7 kbar (0.17 GPa) in both directions (compression
and decompression) at different temperatures. Using an optimized setup (Fig.1),
SAXS and WAXS diffraction data with good statistics could be obtained with 5 ms time-resolution in a single-shot
experiment (Fig.2). It was shown that the time constants for a completion of a phase transition
depend strongly on the magnitude of the depth of the quench into the new phase (Fig.3).
Figure 1.
Set-up of the p-jump experiment: Thermocouple (A), high pressure X-ray cell (B), pressure sensors (C).
Two pressure-circuits are separated by a pneumatic driven valve (D) and are kept at different pressure levels
before activating a p-jump, which is accomplished by quickly opening the valve D, resulting in a quick pressure
equilibration between both reservoirs within a few milli-seconds. Double-stem valve (E) and a motor(G)-driven
pressure pump (F) are used for generating hydrostatic high pressures.
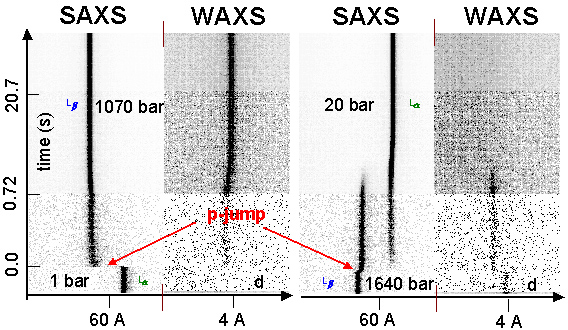
Figure 2. Time-resolved p-jump experiments of
SOPE with p-jump amplitudes as indicated in the plots with a maximum time-resolution of 5 ms at T = 40 deg C.
P-jumps (completed within 10
ms) from the lamellar-fluid to the lamellar-gel phase (left; compression) and vice versa (right;
decompression) are shown in the SAXS region (lamellar lattice-spacing d) and the WAXS
region (lateral (short-range order) lattice-spacing d within the lipid bilayer). Each image
shows 512 frames of a single-shot experiment with decreasing time-resolution (5/50/500ms)
from the bottom to the top (time-normalized, unsmoothed intensity-data displayed in a linear
gray-scale).
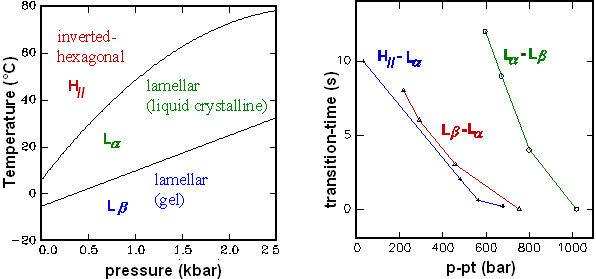
Figure 3. Pressure-Temperature phase diagram of
DOPE in excess water (left), consisting of
two lamellar phases, gel and fluid (liquid crystalline), respectively, and an inverted hexagonal phase. The
figure to the right shows for three different barotropic phase-transitions the dependency of the
transition time of the respective phase undergoing a p-jump induced transition as a function of
the applied p-jump amplitude p-pt, where p is the final pressure after the jump and pt the
transition pressure in the p-T equilibrium phase diagram. The phase transformation proceeds the
faster the higher the jump amplitude (quench into the new phase as being indicative for the
driving force) is chosen.
References:
[1] Pressl, K., Kriechbaum, M., Steinhart, M. & Laggner, P. (1997): High Pressure Cell for
Small- and Wide-Angle X-Ray Scattering.
Rev.Sci.Instrum. 68, 4588-4592 .
[2] Steinhart, M., Kriechbaum, M., Pressl, K., Amenitsch, H., Laggner, P. & Bernstorff, S. (1999): High-
Pressure Instrument for Small- and Wide-Angle X-Ray Scattering. II. Time-Resolved Experiments.
Rev.Sci.Instrum. 70, 1540-1545 .
Author: Manfred Kriechbaum
manfred.kriechbaum@tugraz.at (March 30th 2000) |