Calculation of the Electron Density of a 2D-Hexagonal Lattice from Diffraction Data (Examples).
As an example, the electron density contrast relative to water of a 2D-hexagonal lattice is calculated from (X-ray) diffraction data
(in relative units). We take the experimental data from the paper
Harper et al. 2001, Biophysical Journal, 81, 2693–2706,
for fully hydrated aqueous dispersions of the phospholipid
DEPE (Di-“elaidoyl”-phosphatidyl-ethanolamine) at 85°C.
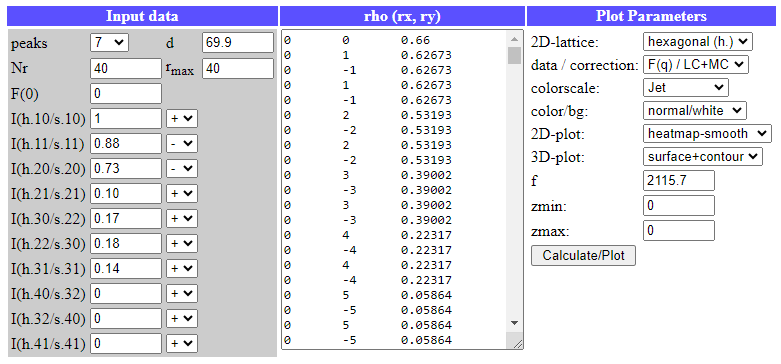
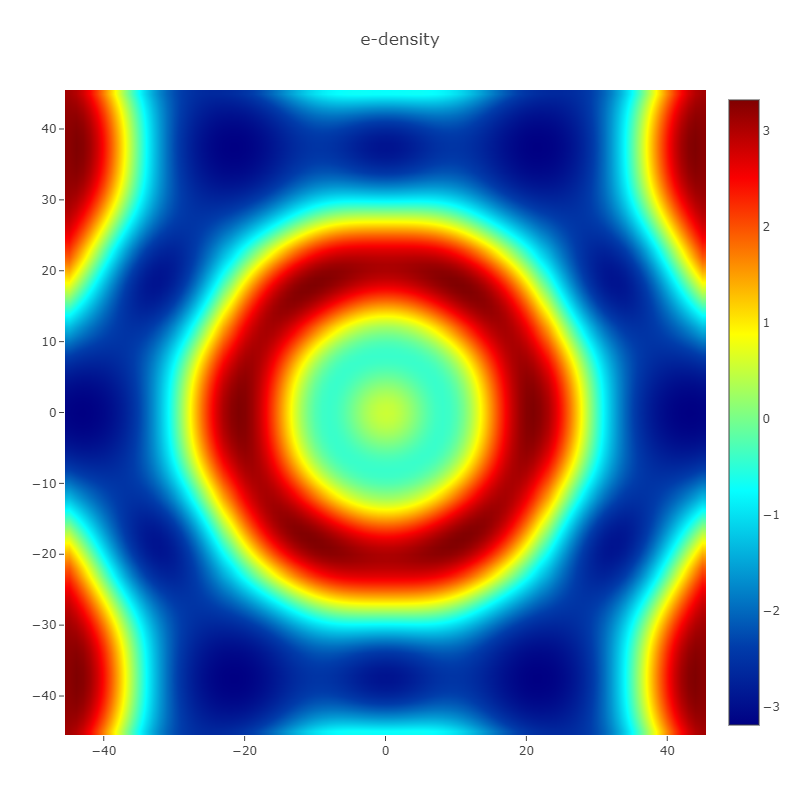
The first 7 diffraction peaks of the hexagonal phase are given with
1.00 / 0.88 / 0.73 / 0.10 / 0.17 / 0.18 / 0.14, which are the Lorentz- and multiplicity-corrected amplitudes with the signs +/-/-/+/+/+/+.
The hexagonal lattice spacing of the lipid at 85°C is 69.9 A.
The parameters for the calculation are entered as input into the
Electron density calculator for 2D-hexagonal or 2D-square lattices as shown below:
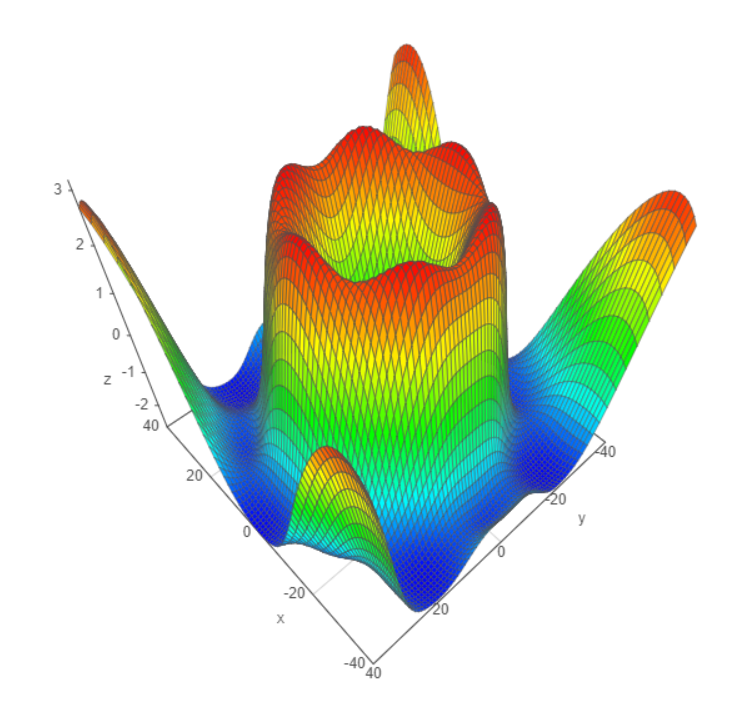
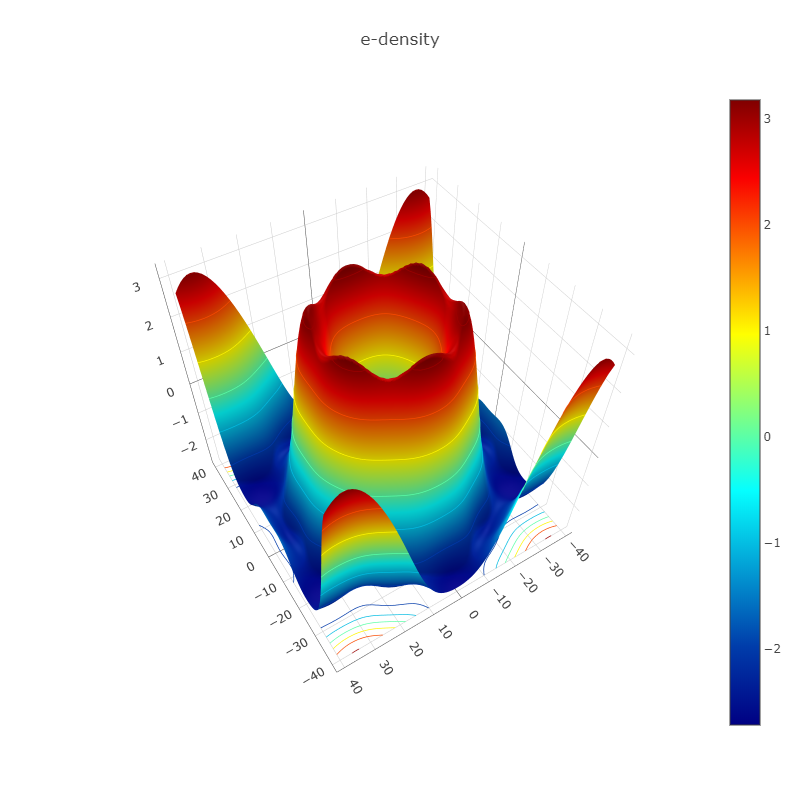
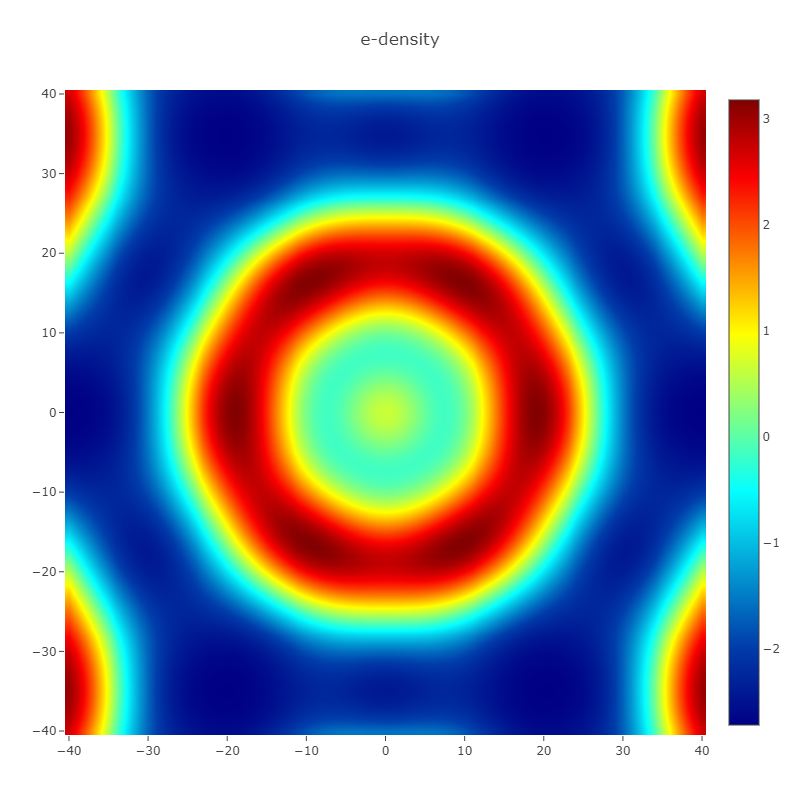
The results (e-density of the hexagonal phase) are plotted in 3D and 2D:
Next, we take similar experimental data from the paper
Harper et al. 2020, Langmuir, 36, 18, 4908–4916, for fully hydrated aqueous dispersions of the phospholipid
POPE (1-palmitoyl-2-oleoyl-sn-glycero-3-phosphatidyl-ethanolamine) with α-tocopherol (mole fraction 0.20) at 40°C.
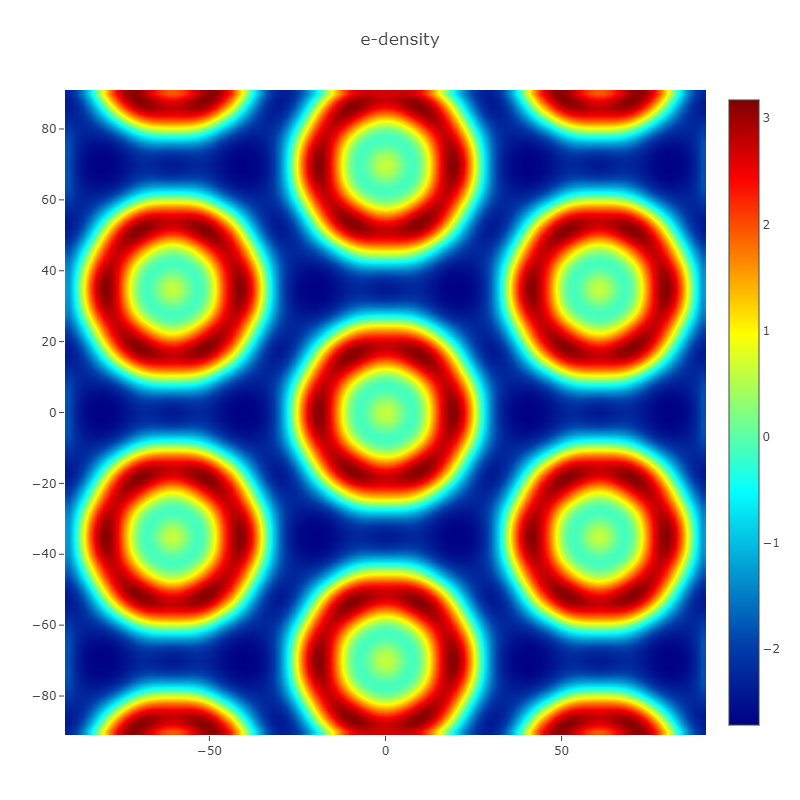
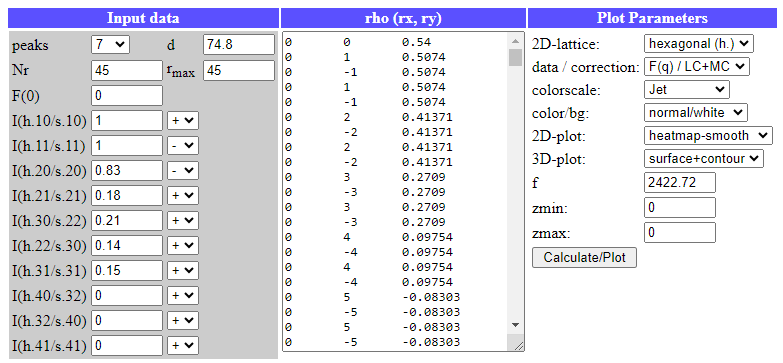
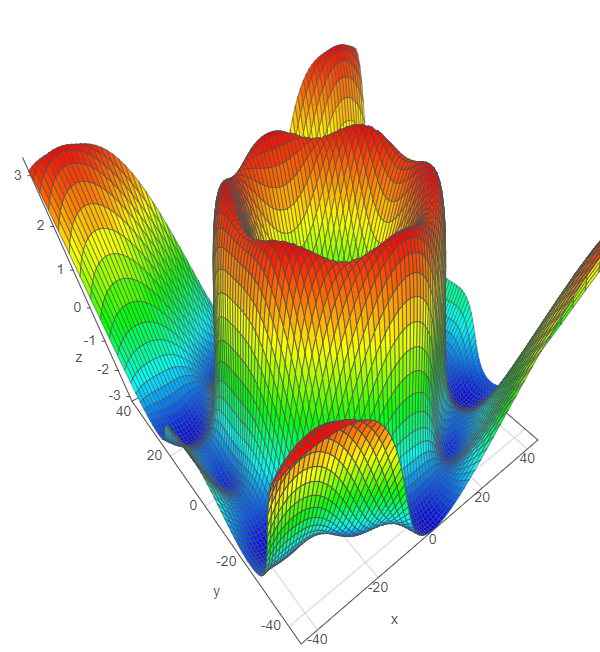
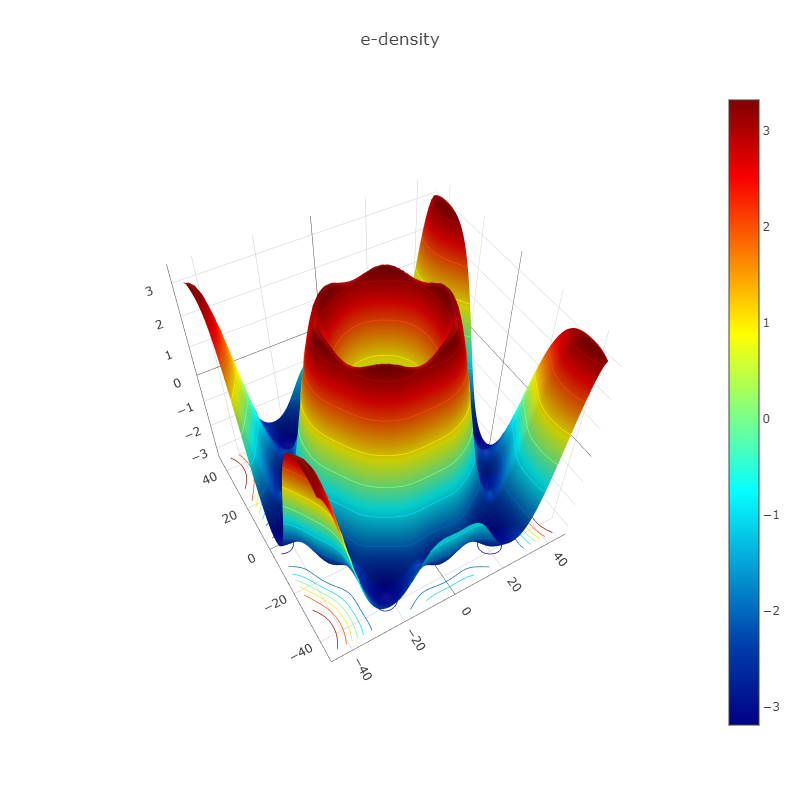
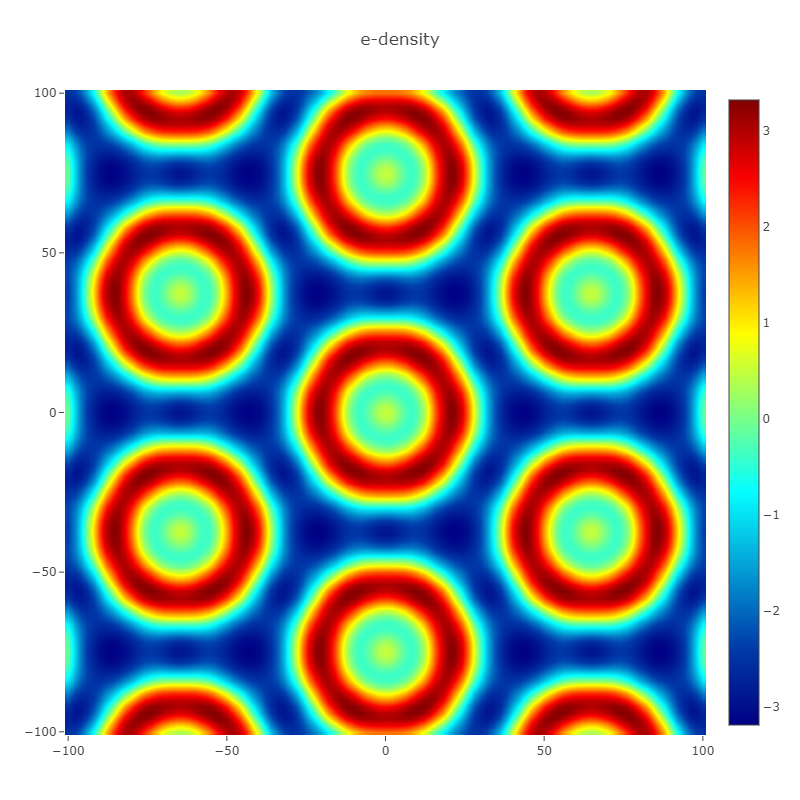
The first 7 diffraction peaks of the hexagonal phase are given with 1.00 / 1.00 / 0.83 / 0.18 / 0.21 / 0.14 / 0.15,
which are the Lorentz- and multiplicity-corrected amplitudes with the signs +/-/-/+/+/+/+.
The hexagonal lattice spacing of the lipid/tocopherol mixture at 40°C is 74.8 A.
The parameters for the calculation are entered as input into the
Electron density calculator for 2D-hexagonal or 2D-square lattices as shown below:
The results (e-density of the hexagonal phase) are plotted in 3D and 2D:
Last, we take the experimental data from the paper
Vancuylenberg et al. 2023, Soft Matter, 19, 8519–8530,
for doped
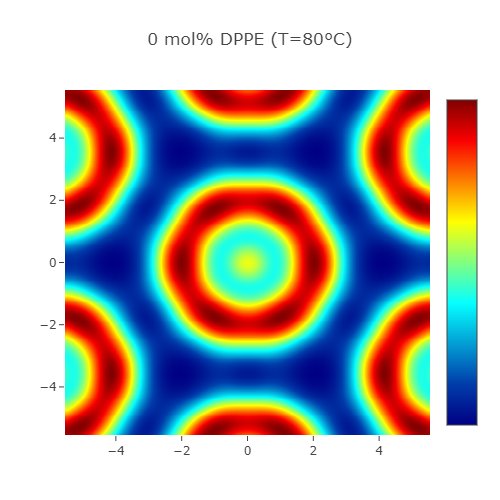
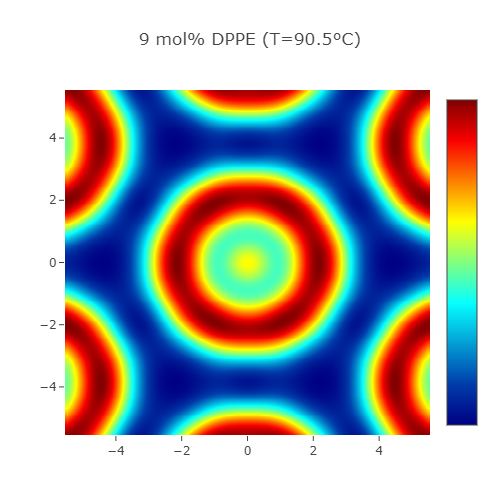
1-palmitoyl-2-oleoyl-sn-phosphatidylethanolamine (POPE) with increasing molar concentrations of
1,2-palmitoyl-sn-phosphatidylethanolamine
(DPPE: 0 to 15 mol%) and a final lipid concentration of 20 wt% in water. The 2D lattice spacings (from 7.12 nm to 7.73 nm),
the values of the amplitudes and their signs (+/-/-/+/+/+/+) for the first seven diffraction peaks are given in
Table S1 of the supplementary information (ESI)
of this paper and were entered as input into the
Electron density calculator for 2D-hexagonal or 2D-square lattices. The images below show the resulting maps of the electron
density contrast relative to water (in relative units) of the 2-dimensional (inverse) hexagonal lattice for the POPE/DPPE
mixtures as function of mol% DPPE (from 0 to 15 mol% and at the respective temperatures). Spatial units are in nm.
Author: M.Kriechbaum, TU-Graz
(2023), e-mail:
manfred.kriechbaum@tugraz.at